Spring Boot 容器选择 Undertow 而不是 Tomcat
Spring Boot 内嵌容器Undertow参数设置
配置项:
|
1 2 3 4 5 6 7 8 9 10 11 12 13 14 15 16 17 |
# 设置IO线程数, 它主要执行非阻塞的任务,它们会负责多个连接, 默认设置每个CPU核心一个线程 # 不要设置过大,如果过大,启动项目会报错:打开文件数过多 server.undertow.io-threads=16 # 阻塞任务线程池, 当执行类似servlet请求阻塞IO操作, undertow会从这个线程池中取得线程 # 它的值设置取决于系统线程执行任务的阻塞系数,默认值是IO线程数*8 server.undertow.worker-threads=256 # 以下的配置会影响buffer,这些buffer会用于服务器连接的IO操作,有点类似netty的池化内存管理 # 每块buffer的空间大小,越小的空间被利用越充分,不要设置太大,以免影响其他应用,合适即可 server.undertow.buffer-size=1024 # 每个区分配的buffer数量 , 所以pool的大小是buffer-size * buffers-per-region server.undertow.buffers-per-region=1024 # 是否分配的直接内存(NIO直接分配的堆外内存) server.undertow.direct-buffers=true |
来看看源代码:
https://github.com/undertow-io/undertow/blob/master/core/src/main/java/io/undertow/Undertow.java
|
1 2 3 4 5 6 7 8 9 10 11 12 13 14 15 16 17 18 19 |
ioThreads = Math.max(Runtime.getRuntime().availableProcessors(), 2); workerThreads = ioThreads * 8; //smaller than 64mb of ram we use 512b buffers if (maxMemory < 64 * 1024 * 1024) { //use 512b buffers directBuffers = false; bufferSize = 512; } else if (maxMemory < 128 * 1024 * 1024) { //use 1k buffers directBuffers = true; bufferSize = 1024; } else { //use 16k buffers for best performance //as 16k is generally the max amount of data that can be sent in a single write() call directBuffers = true; bufferSize = 1024 * 16 - 20; //the 20 is to allow some space for protocol headers, see UNDERTOW-1209 } |
很显然,Undertow认为它的运用场景是在IO密集型的系统应用中,并且认为多核机器是一个比较容易满足的点,Undertow初始化假想应用的阻塞系数在0.8~0.9之间,所以阻塞线程数直接乘了个8,当然,如果对应用较精确的估测阻塞系数,可以配置上去。
Spring Boot内嵌容器支持Tomcat、Jetty、Undertow。为什么选择Undertow?
这里有一篇文章,时间 2017年1月26日发布的:
Tomcat vs. Jetty vs. Undertow: Comparison of Spring Boot Embedded Servlet Containers
1. Setup Spring Boot Application
We will use Maven to setup a new project in Eclipse with the appropriate dependencies. We will use the starter parent for this example but the dependencies in a production application will likely be altered to streamline, optimize or customize.
1.1 Setup Spring Boot Dependencies
The default embedded servlet container is Tomcat. This version of Spring Web 1.4.3 brings in Tomcat version 8.5.6.
pom.xml
|
1 2 3 4 5 6 7 8 9 10 11 12 13 |
<parent> <groupId>org.springframework.boot</groupId> <artifactId>spring-boot-starter-parent</artifactId> <version>1.4.3.RELEASE</version> </parent> <dependencies> <!-- TOMCAT --> <dependency> <groupId>org.springframework.boot</groupId> <artifactId>spring-boot-starter-web</artifactId> </dependency> </dependencies> |
1.2 Setup Spring Boot Main Application and Controllers
To setup the Spring Boot application you include the @SpringBootApplication annotation in your Main class. The @SpringBootApplication annotation brings in @SpringBootConfiguration, @EnableAutoConfiguration and @ComponentScanannotations.
Application.java
|
1 2 3 4 5 6 |
@SpringBootApplication @ConfigurationProperties public class Application { public static void main(String[] args) { SpringApplication.run(Application.class, args); } |
You may choose to eliminate this annotation and add the @SpringBootConfiguration alone or to another class that allows you to customize the configuration. The @ComponentScan will scan your application for items like the @Controller you will need to setup a RESTful service. The following controller will return a simple “Hello World” string from a HTTP GET request. We have also included in the bundled example another endpoint mapping that returns a complex object type.
SampleController.java
|
1 2 3 4 5 6 7 8 9 10 11 |
@Controller public class SampleController { @Autowired private ResourceLoader resourceLoader; @RequestMapping("/") @ResponseBody public String home() { return "Hello World!"; } |
1.3 Key Configuration Parameters
The default properties for all the embedded servlet containers are the same. Some of the most important properties to consider are the properties for configuring startup information like ports and application name, TSL, access logs, compression and many more.
For example, to configure SSL add the following to key value pairs to the application.properties.
application.properties
|
1 2 3 4 |
server.port=8443 server.ssl.key-store=classpath:keystore.jks server.ssl.key-store-password=secret server.ssl.key-password=another-secret |
1.4 How to Find Additional Parameters
To explore the parameters for Spring boot applications you can add the Spring actuator dependency and the @ConfigurationProperties annotation to your Main class. You then visit the /configprops endpoint on your application to get a list of the available properties.
Application.java
|
1 2 3 |
@SpringBootApplication @ConfigurationProperties public class Application { |
pom.xml
|
1 2 3 4 |
<dependency> <groupId>org.springframework.boot</groupId> <artifactId>spring-boot-starter-actuator</artifactId> </dependency> |
1.5 Change version of Embedded Servlet Containers
The embedded servlet container versions are defined in the following parent dependency from the pom. You can change the version of the embedded servlet container by explicitly including the dependency and identifying a new version in the pom. We will show you how in the examples below.
pom.xml
|
1 2 3 4 5 |
<dependency> <groupId>org.springframework.boot</groupId> <artifactId>spring-boot-dependencies</artifactId> <version>1.3.7.RELEASE</version> </dependency> |
2. Tomcat
As Tomcat is the default embedded servlet container there is nothing you need to do to the default implementation to use Tomcat. You can change the version of Tomcat you are using or change properties in the pom.xml or application.properties files.
2.2 Change Version of Tomcat
pom.xml
|
1 2 3 4 5 6 7 8 9 10 11 12 13 14 15 16 17 |
<properties> <tomcat.version>8.5.6</tomcat.version></properties> <dependency> <groupId>org.apache.tomcat.embed</groupId> <artifactId>tomcat-embed-core</artifactId> <version>${tomcat.version}</version> </dependency> <dependency> <groupId>org.apache.tomcat.embed</groupId> <artifactId>tomcat-embed-el</artifactId> <version>${tomcat.version}</version> </dependency> <dependency> <groupId>org.apache.tomcat.embed</groupId> <artifactId>tomcat-embed-websocket</artifactId> <version>${tomcat.version}</version> </dependency> |
3. Jetty
To change the embedded servlet container to Jetty you need to edit the pom file to remove the Tomcat dependency and add Jetty.
3.1 Change to Jetty (version 9.3.14)
pom.xml
|
1 2 3 4 5 6 7 8 9 10 11 12 13 14 |
<dependency> <groupId>org.springframework.boot</groupId> <artifactId>spring-boot-starter-web</artifactId> <exclusions> <exclusion> <groupId>org.springframework.boot</groupId> <artifactId>spring-boot-starter-tomcat</artifactId> </exclusion> </exclusions> </dependency> <dependency> <groupId>org.springframework.boot</groupId> <artifactId>spring-boot-starter-jetty</artifactId> </dependency> |
4. Undertow
To change the embedded servlet container to Undertow you need to edit the pom file to remove the Tomcat dependency and add Undertow.
4.1 Change to Undertow (version 1.3.24 final)
Notice the undertow version included in the spring boot starter is incorrect, referring to 1.3.25. You’ll need to change it to 1.3.24.Final for this to work at the time of this article.
pom.xml
|
1 2 3 4 5 6 7 8 9 10 11 12 13 14 15 16 17 18 19 20 21 22 23 24 |
<dependency> <groupId>org.springframework.boot</groupId> <artifactId>spring-boot-starter-web</artifactId> <exclusions> <exclusion> <groupId>org.springframework.boot</groupId> <artifactId>spring-boot-starter-tomcat</artifactId> </exclusion> </exclusions> </dependency> <dependency> <groupId>org.springframework.boot</groupId> <artifactId>spring-boot-starter-undertow</artifactId> </dependency> <dependency> <groupId>io.undertow</groupId> <artifactId>undertow-core</artifactId> <version>1.3.24.Final</version> </dependency> <dependency> <groupId>io.undertow</groupId> <artifactId>undertow-servlet</artifactId> <version>1.3.24.Final</version> </dependency> |
5. Performance and Load
In this example, we will analyze both the peformance of HTTP requests and the memory footprint at startup of all three embedded servlet containers. We used JMeter to measure performance by simulating load and JVisualVM to look at the memory footprint.
5.1 Measure Performance
In this example, we will analyze both the peformance of simple RESTFul GET requests that return a string and more complex GET requests that return complex JSON objects. JMeter is the tool used to measure the performance of the the three different types of containers. The key to setting up this test was establishing thread groups with the appropriate load, a counter to dynamically update the input to the API and report viewers to display or aggregate the results. For the simple string examples, we used a thread group with 1000 threads that would loop 3 times through the sequence. It also used a ramp up time of 10 seconds. For the complex object examples, we used the same parameters but did not loop.
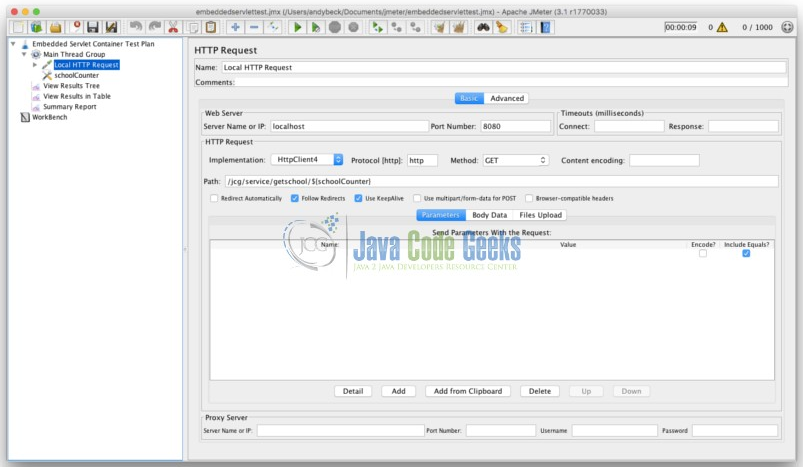
JMeter Tomcat Thread Group
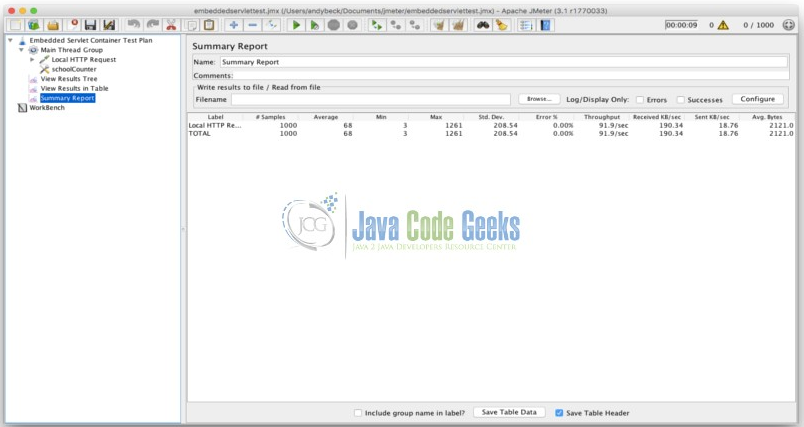
JMeter Tomcat Summary Report
5.1.1 Tomcat
5.1.1.1 Simple String
| Label | # Samples | Average | Min | Max | Std. Dev. | Error % | Throughput | Received KB/sec | Sent KB/sec | Avg. Bytes |
|---|---|---|---|---|---|---|---|---|---|---|
| Startup | 3000 | 7 | 1 | 549 | 35.78374361 | 0 | 293.8583603 | 55.95935572 | 55.67238466 | 195 |
| Others | 3000 | 1 | 0 | 45 | 1.359661682 | 0 | 287.8802418 | 54.82094449 | 54.53981144 | 195 |
| Others | 3000 | 1 | 0 | 24 | 1.155032275 | 0 | 292.1129503 | 55.62697785 | 55.3417113 | 195 |
5.1.1.2 Complex Object with Dynamic Data
| Label | # Samples | Average | Min | Max | Std. Dev. | Error % | Throughput | Received KB/sec | Sent KB/sec | Avg. Bytes |
|---|---|---|---|---|---|---|---|---|---|---|
| Startup | 1000 | 114 | 3 | 1601 | 322.8671905 | 0 | 97.68486861 | 202.3335999 | 19.93763432 | 2121 |
| Others | 1000 | 3 | 2 | 17 | 1.328216473 | 0 | 97.88566954 | 202.7495167 | 19.9786181 | 2121 |
| Others | 1000 | 2 | 1 | 16 | 1.110529603 | 0 | 98.52216749 | 204.0678879 | 20.10852833 | 2121 |
| Others | 1000 | 2 | 1 | 21 | 1.344498419 | 0 | 98.53187506 | 204.0879951 | 20.11050966 | 2121 |
5.1.2 Jetty
5.1.2.1 Simple Object
| Label | # Samples | Average | Min | Max | Std. Dev. | Error % | Throughput | Received KB/sec | Sent KB/sec | Avg. Bytes |
|---|---|---|---|---|---|---|---|---|---|---|
| Startup | 3000 | 7 | 0 | 561 | 40.13705065 | 0 | 291.5168594 | 56.0828333 | 55.22878 | 197 |
| Others | 3000 | 1 | 0 | 21 | 1.058925031 | 0 | 293.5995302 | 56.48350338 | 55.6233485 | 197 |
| Others | 3000 | 1 | 0 | 21 | 0.926034317 | 0 | 294.3485086 | 56.62759395 | 55.7652448 | 197 |
5.1.2.2 Complex Object with Dynamic Data
| Label | # Samples | Average | Min | Max | Std. Dev. | Error % | Throughput | Received KB/sec | Sent KB/sec | Avg. Bytes |
|---|---|---|---|---|---|---|---|---|---|---|
| Startup | 1000 | 110 | 3 | 1397 | 278.7961107 | 0 | 98.13542689 | 203.3626717 | 19.93375859 | 2122 |
| Others | 1000 | 3 | 2 | 20 | 1.500210319 | 0 | 98.48335631 | 204.0836739 | 20.00443175 | 2122 |
| Others | 1000 | 3 | 2 | 45 | 2.729377218 | 0 | 98.29942003 | 203.7025091 | 19.96706969 | 2122 |
5.1.3 Undertow
5.1.3.1 Simple Object
| Label | # Samples | Average | Min | Max | Std. Dev. | Error % | Throughput | Received KB/sec | Sent KB/sec | Avg. Bytes |
|---|---|---|---|---|---|---|---|---|---|---|
| Startup | 3000 | 6 | 0 | 451 | 31.6188702 | 0 | 295.6830278 | 63.81440346 | 56.01807363 | 221 |
| Others | 3000 | 1 | 0 | 22 | 1.255447862 | 0 | 292.7400468 | 63.17924839 | 55.46051669 | 221 |
| Others | 3000 | 1 | 0 | 18 | 1.559477975 | 0 | 294.3773918 | 63.53262069 | 55.77071681 | 221 |
5.1.3.2 Complex Object with Dynamic Data
| Label | # Samples | Average | Min | Max | Std. Dev. | Error % | Throughput | Received KB/sec | Sent KB/sec | Avg. Bytes |
|---|---|---|---|---|---|---|---|---|---|---|
| Startup | 1000 | 70 | 3 | 1114 | 197.1333241 | 0 | 97.059109 | 203.3969361 | 19.62044201 | 2145.893 |
| Startup | 1000 | 42 | 3 | 852 | 132.6443576 | 0 | 98.02960494 | 205.6324135 | 20.00799554 | 2148 |
| Others | 1000 | 3 | 2 | 19 | 1.293570253 | 0 | 98.55129595 | 206.6305004 | 20.01823199 | 2147 |
| Others | 1000 | 2 | 2 | 27 | 1.659250132 | 0 | 98.74592673 | 207.0385788 | 20.05776637 | 2147 |
| Others | 1000 | 2 | 1 | 17 | 1.260904041 | 0 | 98.28975821 | 206.0821395 | 19.96510714 | 2147 |
5.2 Measure Memory
To measure the memory of each embedded servlet container we looked at the memory usage on startup. JVisualVM is a tool provided with the Java Development Kit for visualizing the memory and footprint of java applications. We used this tool to show the initial startup impact of each of the three embedded servlet containers. The heap size and thread counts are key in analyzing this initial footprint. The ten threads that are common to all three containers include: JMX server connection timeout, RMI Scheduler, RMI TCP Connection (2), RMI TCP Accept, Attach Listener, DestroyJavaVM, Signal Dispatcher, Finalizer and Reference Handler.
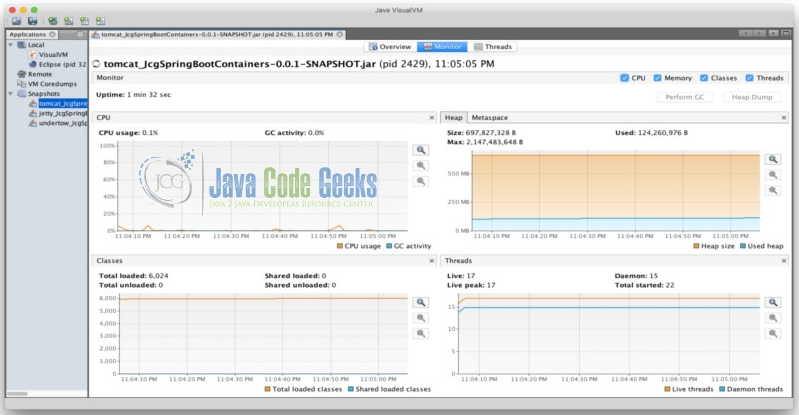
JVisualVM Report
5.2.2 Tomcat
Heap Size: 697,827,328 B
Used: 124,260,976 B
Max: 2,147,483,648 B
Threads: 17 Live, 22 Started
5.2.3 Jetty
Heap Size: 628,621,312 B
Used: 311,476,776 B
Max: 2,147,483,648 B
Threads: 19 Live, 22 Started
5.2.4 Undertow
Heap Size: 630,718,464 B
Used: 114,599,536 B
Max: 2,147,483,648 B
Threads: 17 Live, 20 Started
6. 对比
6.1 性能
压测结果:从上面的6张压力测试报告中,可以看到3个容器在相同的用例及并发请求下,Undertow稍微比Tomcat和Jetty好一点。
资源消耗:JETY启动时内存占用最大,使用311 MB。Tomcat和Undertow的初始脚印相似,在120 MB左右,Undertow出现在114 MB的最低水平。响应头中的关键差异在于默认情况下默认情况下包括HTTP持久连接。该头将在支持持久连接的客户端中使用,以通过重用连接细节来优化性能。
6.1.1 Tomcat Response Headers
|
1 2 3 4 |
Content-Type →application/json;charset=UTF-8 Date →Mon, 09 Jan 2017 02:23:26 GMT Transfer-Encoding →chunked X-Application-Context →JcgSpringBootContainers:# Application index. |
6.1.2 Jetty Response Headers
|
1 2 3 4 |
Content-Type →application/json;charset=UTF-8 Date →Mon, 09 Jan 2017 02:29:21 GMT Transfer-Encoding →chunked X-Application-Context →JcgSpringBootContainers:# Application index. |
6.1.3 Undertow Response Headers
|
1 2 3 4 5 |
Connection →keep-alive Content-Type →application/json;charset=UTF-8 Date →Mon, 09 Jan 2017 02:20:25 GMT Transfer-Encoding →chunked X-Application-Context →JcgSpringBootContainers:# Application index. |
7. 结论
这些数字表明Undertow在性能和内存使用方面是最好的。令人鼓舞的是,Undertow 正在接受最新的能力,并默认为持久的连接。这些数字并不表示在这个例子中使用的负载有显著的性能差异,但我想它们会缩放,如果性能是最重要的因素,则Undertow 是应用程序的正确匹配。认为一个组织可能因为熟悉它的能力而喜欢嵌入的servlet容器也是合理的。很多时候默认设置将不得不改变,因为应用程序要求包括性能、内存使用和功能。
=========================分割线=================================================================================
在Spring Boot中使用 Undertow 而不是 Tomcat
1、Maven示例:
|
1 2 3 4 5 6 7 8 9 10 11 12 13 14 |
<dependency> <groupId>org.springframework.boot</groupId> <artifactId>spring-boot-starter-web</artifactId> <exclusions> <exclusion> <groupId>org.springframework.boot</groupId> <artifactId>spring-boot-starter-tomcat</artifactId> </exclusion> </exclusions> </dependency> <dependency> <groupId>org.springframework.boot</groupId> <artifactId>spring-boot-starter-undertow</artifactId> </dependency> |
2、配置Undertow,application.yml示例:
|
1 2 3 4 5 6 7 8 9 10 11 12 |
server.undertow.accesslog.dir= # Undertow access log directory. server.undertow.accesslog.enabled=false # Enable access log. server.undertow.accesslog.pattern=common # Format pattern for access logs. server.undertow.accesslog.prefix=access_log. # Log file name prefix. server.undertow.accesslog.rotate=true # Enable access log rotation. server.undertow.accesslog.suffix=log # Log file name suffix. server.undertow.buffer-size= # Size of each buffer in bytes. server.undertow.buffers-per-region= # Number of buffer per region. server.undertow.direct-buffers= # Allocate buffers outside the Java heap. server.undertow.io-threads= # Number of I/O threads to create for the worker. server.undertow.max-http-post-size=0 # Maximum size in bytes of the HTTP post content. server.undertow.worker-threads= # Number of worker threads. |
3、使用 Undertow 监听多个端口示例:
|
1 2 3 4 5 6 7 8 9 10 11 12 13 |
@Bean public UndertowEmbeddedServletContainerFactory embeddedServletContainerFactory() { UndertowEmbeddedServletContainerFactory factory = new UndertowEmbeddedServletContainerFactory(); factory.addBuilderCustomizers(new UndertowBuilderCustomizer() { @Override public void customize(Builder builder) { builder.addHttpListener(8080, "0.0.0.0"); } }); return factory; } |
from:https://www.cnblogs.com/duanxz/p/9337022.html