Eclipse 配置XDebug图文详解
1.php.ini配置
eaccelerator.shm_only="0"
zend_extension ="D:\xampp\php\ext\php_xdebug.dll"
;载入Xdebug
[xdebug]
;开启远程调试
xdebug.remote_enable = 1
xdebug.profiler_enable = off
xdebug.profiler_enable_trigger = off
xdebug.profiler_output_name =cachegrind.out.%t.%p
xdebug.profiler_output_dir ="D:\xampp\tmp"
xdebug.show_local_vars=0
;开启自动跟踪
xdebug.auto_trace = 1
;开启异常跟踪
xdebug.show_exception_trace = 1
;开启异常跟踪
xdebug.remote_autostart = 1
;收集变量
xdebug.collect_vars = 1
;收集参数
xdebug.collect_params = 1
;trace输出路径
xdebug.trace_output_dir ="D:\xampp\tmp"
;以下三个分别是主机、端口、句柄
xdebug.remote_host="127.0.0.1"
xdebug.remote_port=9000
xdebug.remote_handler="dbgp"
2.eclipse配置修改
2.1. 位置:windows->Preferences
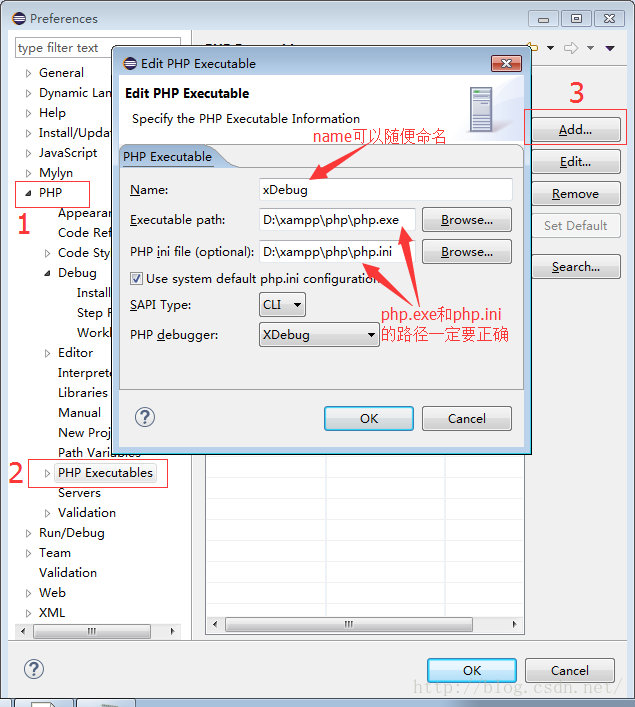
2. 2 配置Executables(配置完成后,若设置断点能正常让XDebug运行,则无需继续设置其他选项)
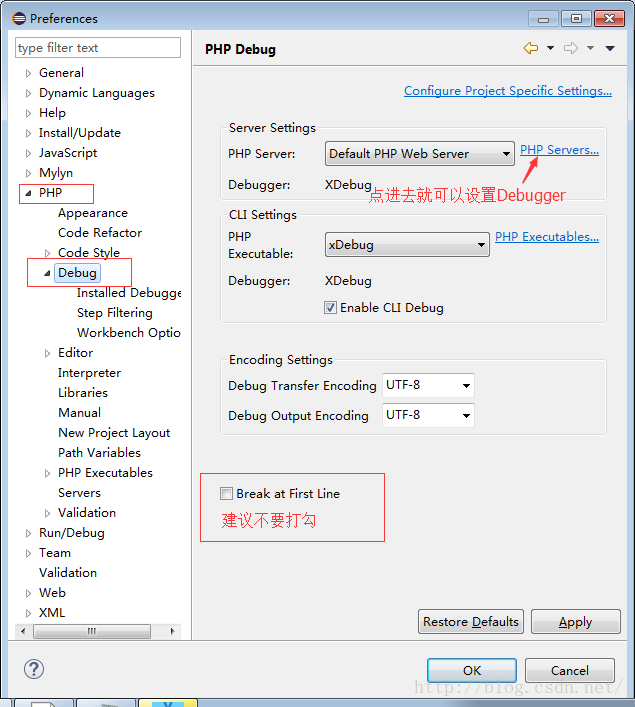
2.3.配置 PHP Debug
将Server Settings下的Debugger设为XDebug
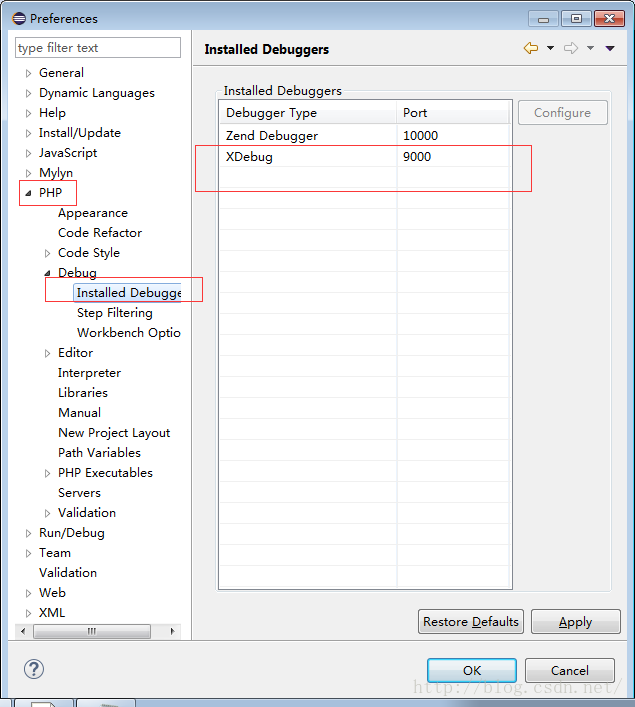
2.4.配置Debuggers
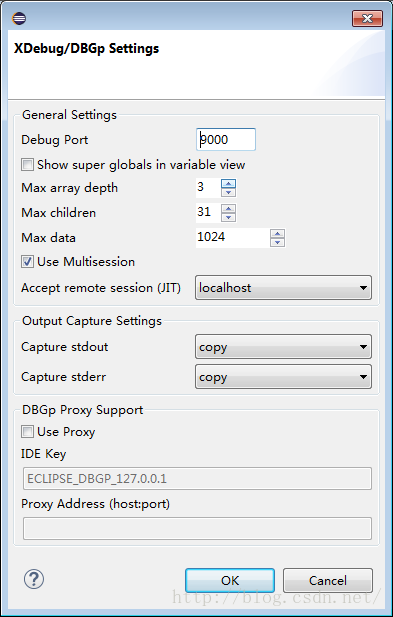
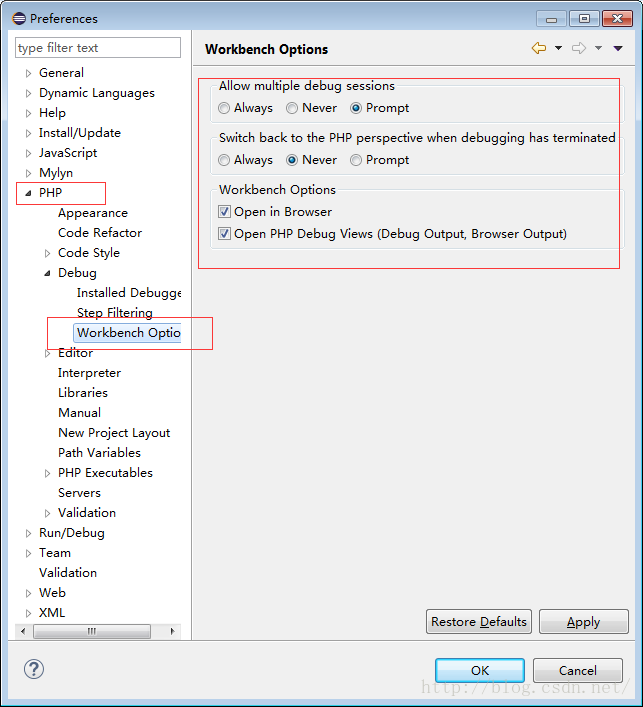
2.5配置workbench Options
from:https://blog.csdn.net/user1218/article/details/51135753